Devloop
Browser control + dev-server logs on one correlated timeline — so a browser console error and the backend stack trace from the same moment sit side by side. For AI agents and humans.
Watch it work
Screenshots
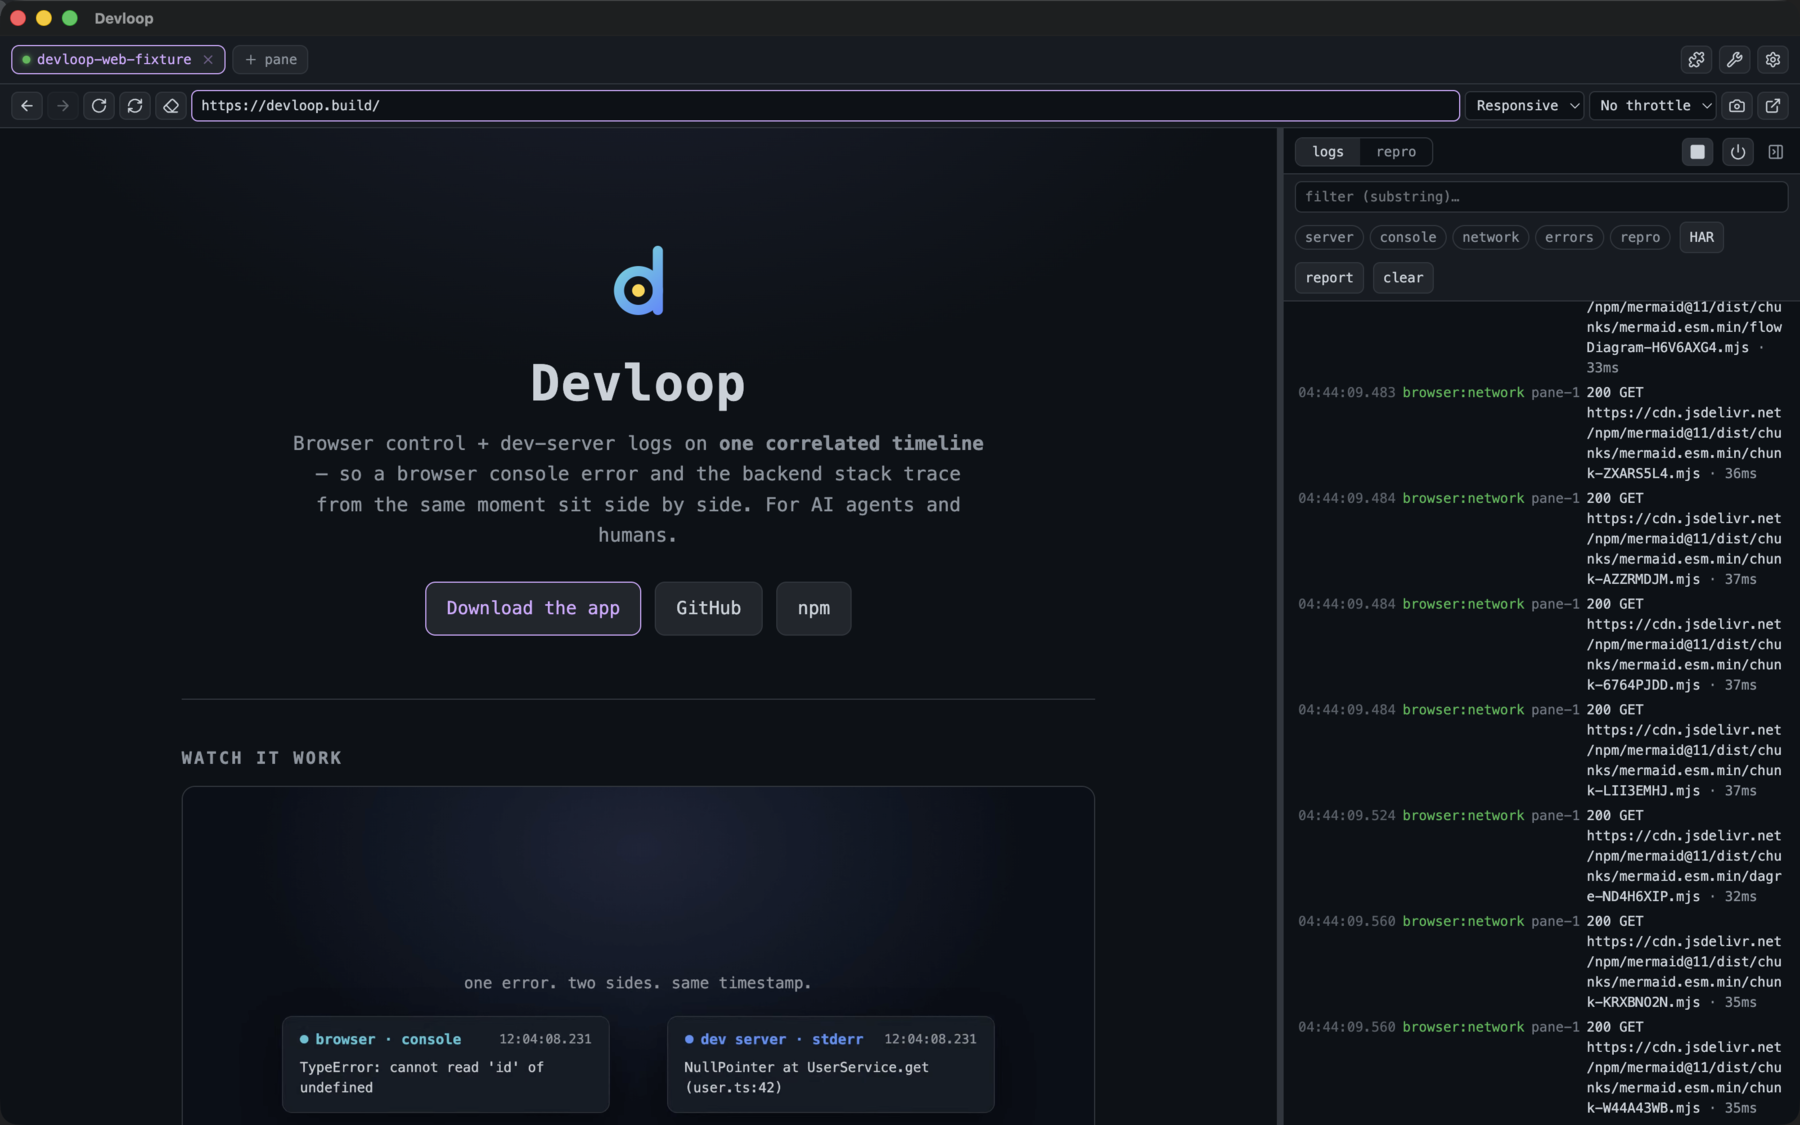
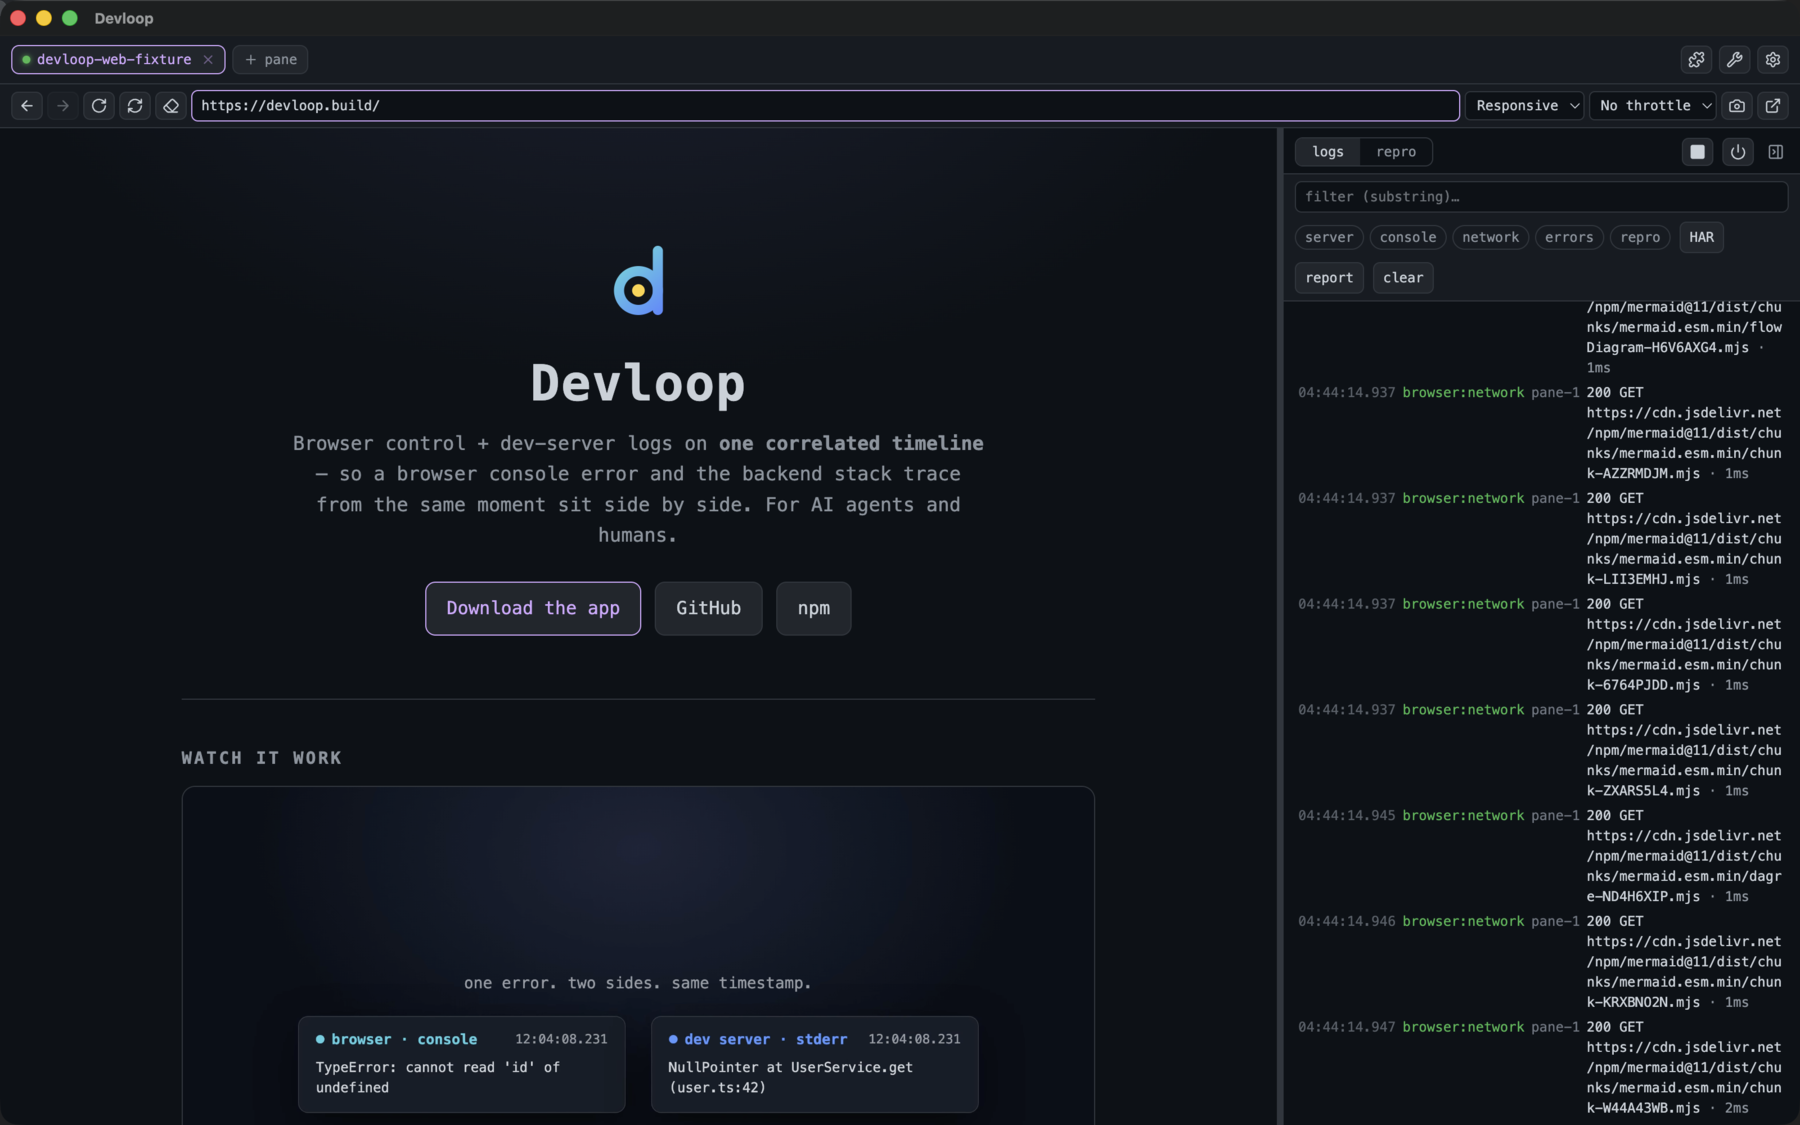
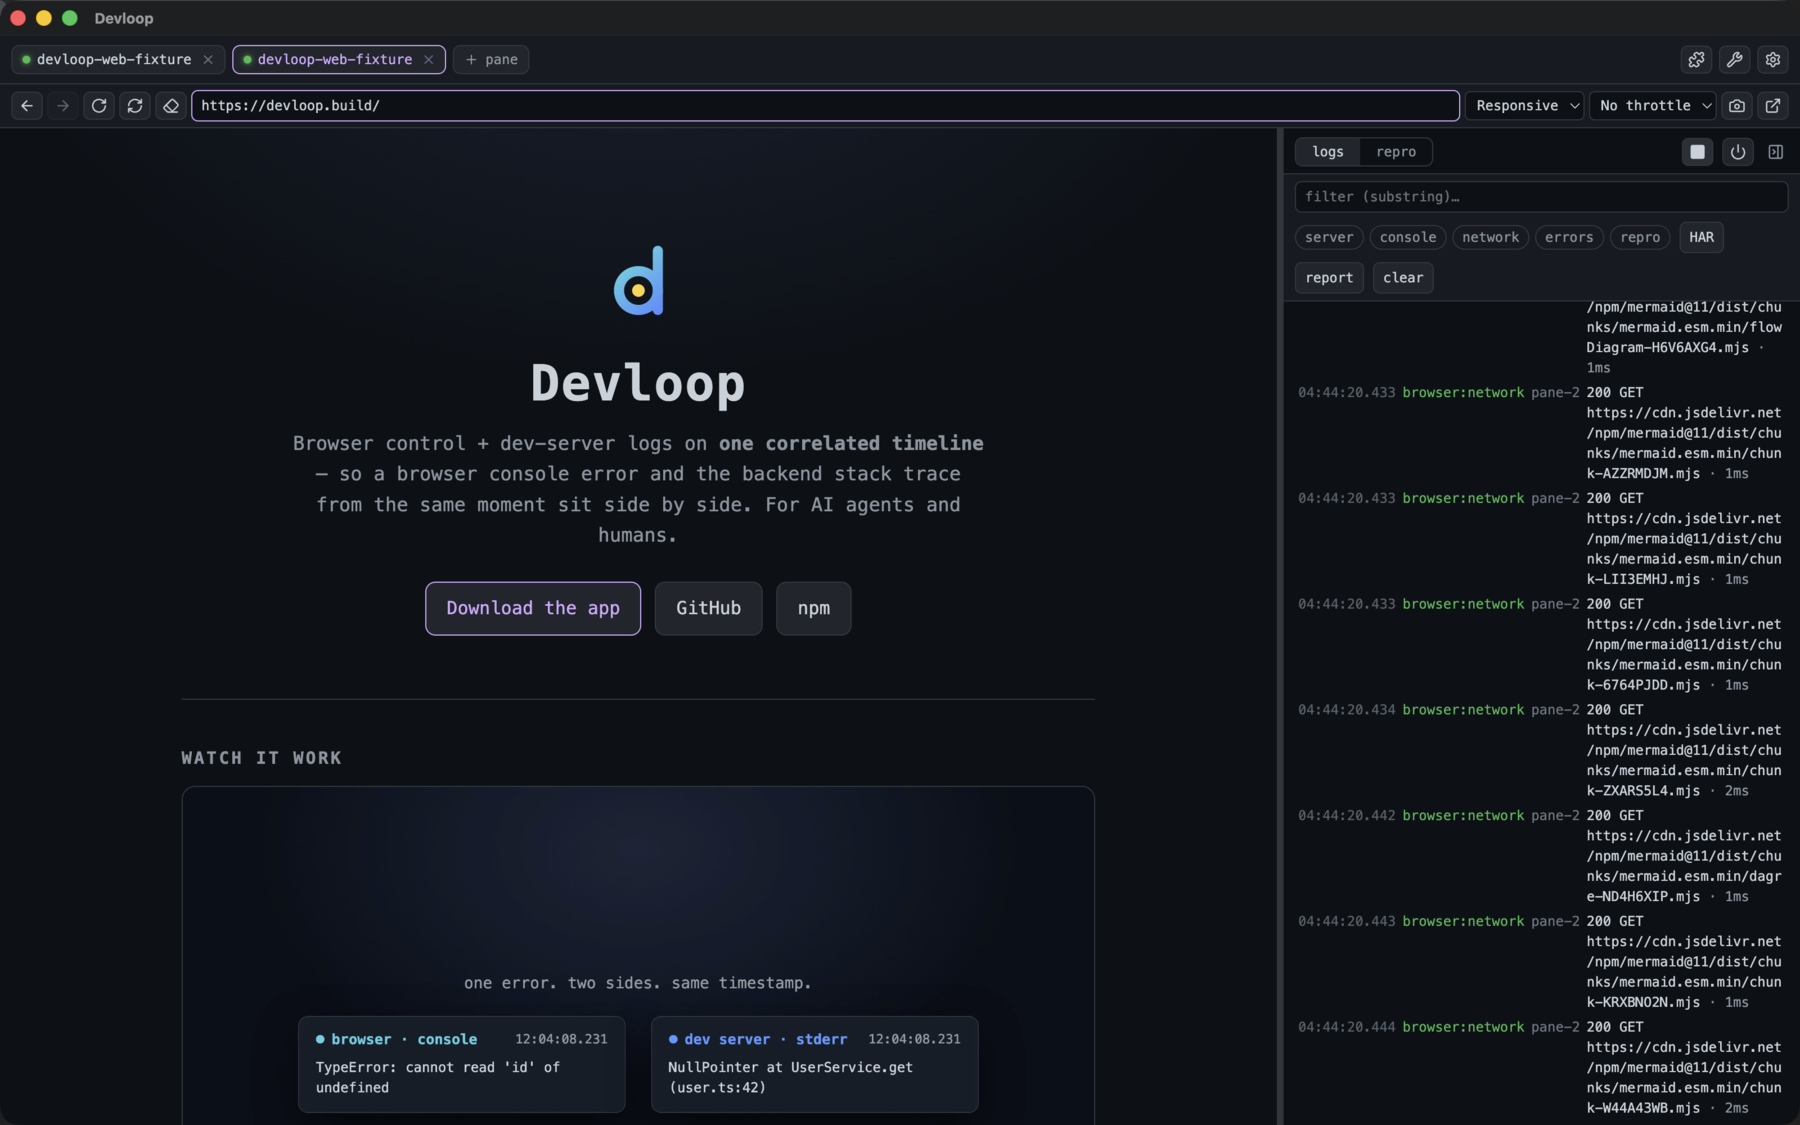
Use it with Claude (MCP)
claude mcp add devloop --scope user -- npx -y devloop-mcpThen, in any project: “dev_start and repro a navigate to /projects.” It starts your dev server, drives the browser, and returns a correlated slice of both sides. Need one instance shared across agents? devloop-mcp daemon. MCP blocked by an enterprise sandbox? Drive the tools as shell commands — see the mcporter guide.
Make your agent reach for it
Drop this in your CLAUDE.md (or any agent's rules file) so it drives features through Devloop and verifies them live — instead of guessing from the code:
For browser or Expo / React Native feature work, use **devloop**:
- dev_start, then browser_navigate (or native_open for iOS/Android).
- After a change, reproduce it with `repro` and read the result —
  never claim a fix works without exercising it in the running app.
- browser_snapshot for clickable element refs; `diagnose` +
  get_logs_around to line up a console error with the matching
  server stack trace from the same moment.
- Done = verified live in devloop: no console/page errors, the
  expected network calls succeeded, the UI reflects the change.
- Setup stays yours: devloop names the missing toolchain + the fix
  command — it diagnoses, never installs. Run it, then rebuild.
The full copy-paste block is in the README.
Or run the cockpit
A desktop app: tabbed browser panes (and Expo iOS/Android targets) beside a unified, filterable timeline, a repro builder, an element picker, and pop-out browser windows. Grab your platform:
What it does
One timeline
Server stdout/stderr and browser console/network/page-errors share one clock — correlate cause and effect across the stack.
Web and native
Drive a browser, or an Expo/React Native app on the iOS simulator or an Android emulator — live device in the pane, native logs + RN network on the same timeline, snapshot/tap via idb/adb.
repro
Run an action sequence (navigate / click / type / eval), wait for network idle, and get everything that happened on both sides.
Per-app scoping
Run several projects at once; query logs by app name, not just the active pane. Each project gets isolated browser storage.
Shared daemon
Run one devloop-mcp daemon and many agents/sessions share it over HTTP/SSE — one browser, one dev server, one timeline.
Agent-drivable
Headless stdio for Claude Code, MCP-over-HTTP for the cockpit + daemon, or call the tools as plain shell commands via mcporter when MCP is sandboxed.
Architecture
Three transports expose one shared, transport- & substrate-agnostic core, which drives a browser — or a native device. Everything lands on one timeline.
FAQ
How do I see browser console errors and backend logs together?
Devloop timestamps your dev server's stdout/stderr and the browser's console, network, and page errors into one buffer, so a console error and the backend stack trace from the same moment line up on a single correlated timeline.
Does it work with Claude Code and MCP?
Yes. Devloop is an MCP server. Add it with 'claude mcp add devloop --scope user -- npx -y devloop-mcp' and Claude Code can drive your browser and dev server and read both sides of the timeline.
Can it drive a native iOS or Android app?
Yes — it controls an Expo / React Native app on the iOS simulator or an Android emulator, with native logs and RN network on the same timeline and snapshot/tap via idb/adb.
How is this different from Puppeteer or browser devtools?
Those show only the browser side. Devloop correlates the browser with your dev-server logs (and native logs) on one clock, and exposes it to AI agents over MCP — so you debug cause and effect across the whole stack, not just the front end.
What if MCP is blocked by an enterprise sandbox?
Drive the same tools as plain shell commands via mcporter — see the mcporter guide in the GitHub README.
Can multiple agents share one instance?
Run 'devloop-mcp daemon' and many agents or sessions share it over HTTP/SSE — one browser, one dev server, one timeline.